Same like Euro, market moves a up, took a breath then it breaks the up fractal..
Buy at 0.9967
Stop loss at 0.9941 for now or the red line
Close Position
No exit signal from hourly chart, close position based on gut feeling hehe, ao price divergence
15 min chart AO divergence, price close below red line, alligator start to sleep..
Close position at 0.9990, a total profit of 23 pips..
Tuesday, 14 December 2010
EUR/USD week 3 cont...
Market moves up, and took a breath. Then it break the up fractal....
Buy at 1. 3403
Stop Loss at 1.3371 for now (Previous 2nd fractal)
Close Position
Decide to close position using bearish divergent bar low instead of the red or the green line stop loss, coz AO and price divergence.... play it safe :)
Close at 1.3429, a total profit of 26 pips...
Buy at 1. 3403
Stop Loss at 1.3371 for now (Previous 2nd fractal)
Close Position
Decide to close position using bearish divergent bar low instead of the red or the green line stop loss, coz AO and price divergence.... play it safe :)
Close at 1.3429, a total profit of 26 pips...
Monday, 13 December 2010
EUR/USD week 3
Just found out, my buy stop got hit, break up fractal..
BUY at 1.3246
Close Position
Hit my 5 bar trailing stop
Close position at 1.3376, a total profit of 130 pips..
The power of saddle point, the longer it sleeps the better when it wakes up... :)
BUY at 1.3246
Close Position
Hit my 5 bar trailing stop
Close position at 1.3376, a total profit of 130 pips..
The power of saddle point, the longer it sleeps the better when it wakes up... :)
Friday, 10 December 2010
EUR/USD week 2 (Dec 10) cont....
Buy at 3264
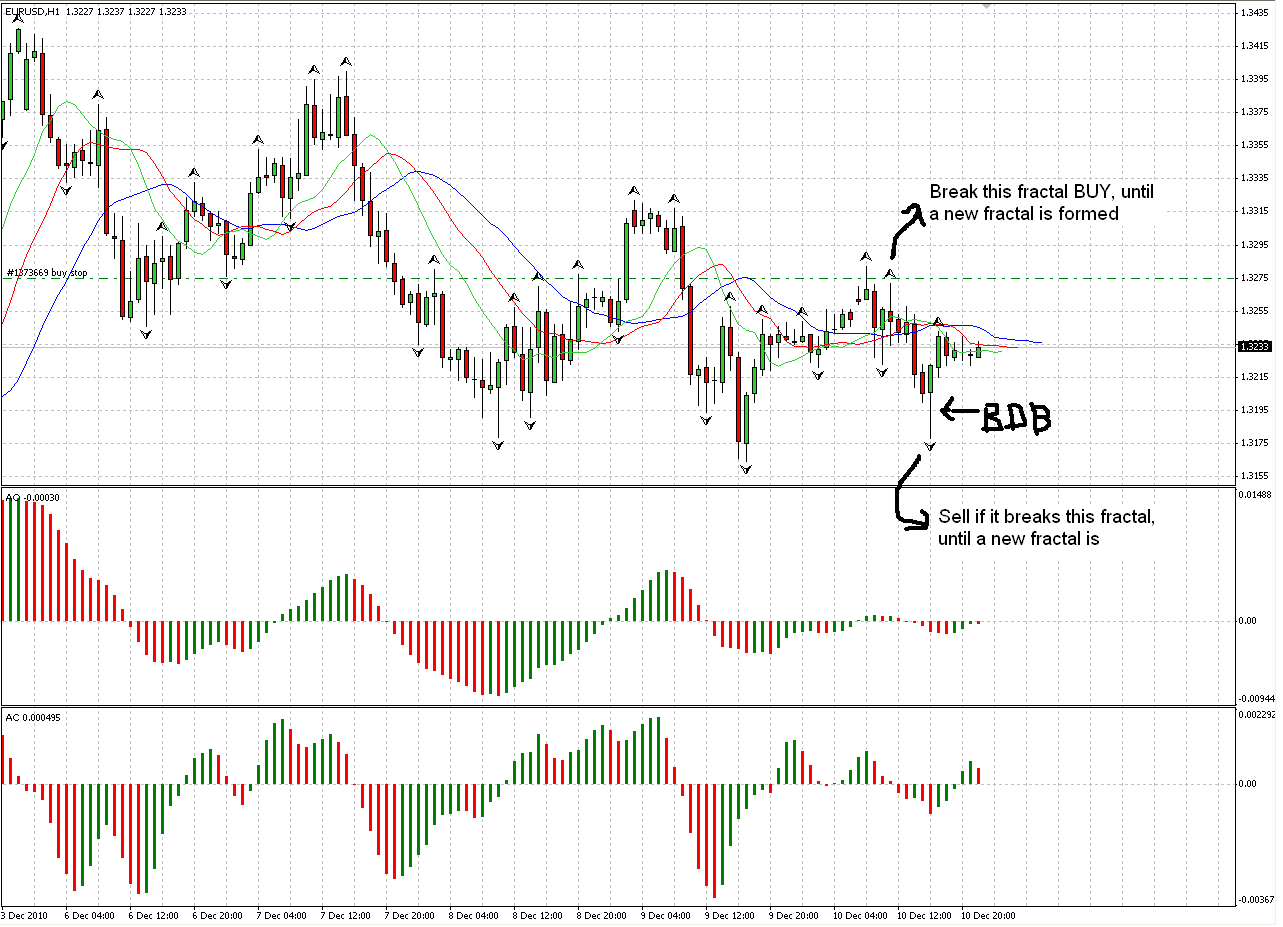
A bracketed market (saddle point), break up fractal.
Close Position 1
a bearish divergent bar, close position at 3261, 3 pips loss hehehehe... get ready to sell if it breaks the down fractal or buy again one tick above bdb high.. :)
Another Saddle Point
Sell at 1.3222
Daily chart: Alligator open up, price below alligator
4 hour chart: Alligator intertwine, price below alligator
Close Position 2
Close position, one tick above bdb high at 1.3226, a total loss of 4 pips..
Alligator still sleeping, a sideway market, watch this market carefully, the longer it sleeps the better. Won't miss this breakout.. :)
Thursday, 9 December 2010
EUR/USD week 2 (Dec 10)
Hopefully my wave count correct...
Target zone would be around 3495-3669
Close Position
Hit my stop loss at 3242 (the last fractal), a total profit of 13 pips.
From floating profit 80+ pips :(
Forgot with the 5 bar stop loss at 3289 (+60 pips). Hmm.. need to remember that, since the trend still too early too tell, should've used tight stop...
Ok noted, Now let's just wait for next opportunity :)
Just remember the rule (saddle point)
2nd Trade of the day
Decided to enter the 2nd BDB, buy at 3230.
Had a couple of bad experience with wiseman 1, need to be careful with this one. That's why i entered on the 2nd bdb, need to make sure there's really a buying pressure out there and also it stops around 72% fibonacci, which is a typical end of wave 2.
Hopefully my wave count is correct. Well if it breaks 3179 then the wave count fails..
Why not give it a shot :) We'll see...
Close position
Hit my stop loss at 1.3193, a total loss of 37 pips :(
oh well.. let's wait for next opportunity..
Still need to figure how to use wiseman 1, a gambling phase indeed.. :)
Thursday, 18 November 2010
AUD/USD Position Week 3
Back to hourly trading, guess i'm not ready yet to trade the daily (psychology and money management issue).
1st and 2nd Trade (hourly chart)
Bought Aud at 0.9790 yesterday. For this one, i'll use trailing stop and just let the profit run..
Also bought at 0.9785 with a target profit: near Fibonacci 38.2 retracement at 0.9860.
We'll see how it goes... :)
Update Position
2nd Trade hit the target profit, a total profit of 70 pips :) not bad...
Still holding one position, let's see how far it can go
Update Position
Hit my trailing stop (one tick below the lowest previous 5 bar) close my 1st trade at 0.9870, a total profit of 85 pips :)
looks like fib 38.2 retracement become a resistance..
Should i buy if it breaks the up fractal? hmm... we'll see
Thursday, 4 November 2010
GBP/USD Position week 1
My first trade using daily.. weww, nice move, woohooo!! I
As i said before (look GBP/USD view), buy if it breaks the up fractal around 1.6110..
I bought a lil bit higher though at 1.6131...Well the market moves as expected..
Let's ride the trend and i"ll use the red line as my protective stop loss...
17 nov 2010 (update) close position
Hit my stop loss at 1.5950, a total loss of 181 pips.
Hmm.. Daily trade, less work and monitor to do but with a bigger whiplash...
If it breaks the last up fractal, i'll jump back in...
Let's try trading with the 4 hourly chart....
Subscribe to:
Posts (Atom)