Friday, 11 May 2012

AUD/USD Trade, Fibonacci, Wiseman 1 and Divergence

AUD/USD Hourly

It's a clear downtrend, draw a fibonacci from last swing low then pay attention on the 38.2, 50 and 61.8 fibo retracement. Look for a sell signal around those area since it's a downtrend.

Zoom out to 15 min chart

AUD/USD 15 min

This is what happen when price at 50 fibonacci, a divergence with bearish candle, enter at 1.0108, stop loss would be just above last fractal, -20 pips risk, it didn't reach my target. A breakeven trade out at 1.0108
AUD/USD 15 min

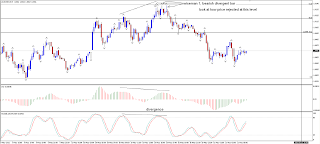
and this is when price at 61.8 fibo, a wiseman 1 and a divergence, enter at 1.0136, hit my target at 1.0076 near 61.8 hourly fibo retracement for a 60 pips profit

Saturday, 21 April 2012

GBP/USD and USD/CAD Wiseman 1 trade

GBP/USD Hourly

Too bad price did not retrace to the blue line, I was waiting to buy this one, a strong up trend indeed.

Took a counter trend, wiseman 1 at daily high (resistance) with divergence, Sell at 1.6060. Price went down and stall at support forming a double bullish divergent bar. Close my position at the open of next candle 1.6024,  for a 36 pips profit. Too bad it didn't go to my profit target at blue line.

Then price come back to re-test the daily high. I was hoping for an abc pattern, so I sell again at 1.6059 but then got stop out at 1.6076, for -17 pips loss.

Price continue heading up, now is testing daily high (8 nov 2011), another wiseman 1, didn't see this one. let see how price react at this area. hmm... a good opportunity to sell.

USD/CAD Hourly

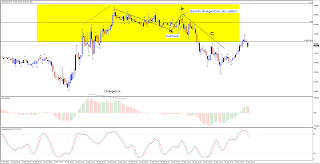
Yellow box, Sell zone. If we zoom out to 15 min chart

USD/CAD 15 min
There's an abc pattern, start with divergence, then price go down, retrace back up, form a bearish divergent bar (right at the 79 fibo retracement), sell at 0.9946, close at 0.9910 (61.8 fibo retracement of the leg up), for 36 pips profit.

Tuesday, 13 March 2012

EUR/USD Trade review

EUR/USD Hourly

1st trade,
There's a divergence then an engulfing candlestick pattern, don't have to remember the name, by looking at the candle we can see there's a buying pressure.. Enter buy at 1.3106 for a 30 pips stop loss. My profit target is just around 38.2 fibonacci retracement at 1.3151 for 45 pips profit

2nd trade,
Price stall at 50 percent fibonacci retracement, then i zoom out to 15 min chart

EUR/USD 15 min

Enter sell when it retrace at 1.3173, stop loss 20 pips just above last swing high.. Closed my position at 1.3183 for 42 pips profit.. Then it continue goin down T_T.. My original plan is to close at around 1.3080 (previous daily low) but my psychology get the best of me..

oh well until next opportunity...

Wednesday, 7 March 2012

GBP/USD beautiful move and I missed it T_T

GBP/USD Hourly

How come i missed this one?! Too much watching USD/JPY... I don't know why but GBP/USD always, well not always but most of time will stall at 50 % fibonacci retracement... When it arrives to this key level, zoom out to smaller time frame to see if there's a divergence..

GBP/USD 15 min

A divergence, damn!! three ways we can enter, first using bdb, 2nd there's a trendline break and 3rd one is using fractal breakout... Didn't want to count how many pips I missed T_T

oh well, until next opportunity...

USD/JPY Head n Shoulder (abc pattern)

USD/JPY Hourly

First clue is divergence, then price moved down (wave a), retrace back to 61.8 fibonacci (wave b), shud've enter earlier around this area but didn't see it. Price continue to go down, break trend line, enter Sell at 81.28, close at 80.88 for a 40 pips profit (near support area)...

Tuesday, 6 March 2012

Wiseman 1 and a Divergence on EUR/USD and GBP/USD

EUR/USD Hourly

A simple divergence and a bullish divergent bar, Buy at 1.3188.. Didn't hit my target profit so I just close it for 30 pips profit at 1.3218.. 

GBP/USD Hourly

Buy at 1.5810, Stop loss at 1.5784... Hit my target profit for a 40 pips profit at 1.5850...

Saturday, 3 March 2012

GBP/USD abc pattern & AUD/USD head n shoulder

GBP/USD Hourly

My favorite pattern, start with a divergence then price went down (wave a), rebound and stop at 79 Fibonacci retracement (wave b), then start to go down again break my trendline, enter sell at 1.5955 with a stop loss at 1.5979 (-24 pips risk). Close 60 % of my position at 1.5905 near support for 50 pips profit  then the remaining 40% close it at 1.5855 for 100 pips profit.. Wanted to hold a bit more but too scared already, don't have the mentality..

Divergence is indeed a powerful stuff. Really really loved it!!

Then the next trade is AUD/USD, a head and shoulder pattern

AUD/USD Hourly

Enter on fractal breakout at 1.0788, close position near the red trendline at 1.0758 for 30 pips profit