 |
| GBP/USD Hourly |
Too bad price did not retrace to the blue line, I was waiting to buy this one, a strong up trend indeed.
Took a counter trend, wiseman 1 at daily high (resistance) with divergence, Sell at 1.6060. Price went down and stall at support forming a double bullish divergent bar. Close my position at the open of next candle 1.6024, for a 36 pips profit. Too bad it didn't go to my profit target at blue line.
Then price come back to re-test the daily high. I was hoping for an abc pattern, so I sell again at 1.6059 but then got stop out at 1.6076, for -17 pips loss.
Price continue heading up, now is testing daily high (8 nov 2011), another wiseman 1, didn't see this one. let see how price react at this area. hmm... a good opportunity to sell.
 |
| USD/CAD Hourly |
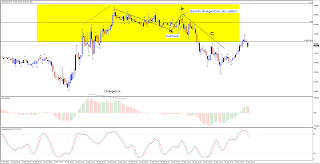
Yellow box, Sell zone. If we zoom out to 15 min chart
 |
| USD/CAD 15 min |
No comments:
Post a Comment