Saturday 25 December 2010

Merry X'mas & Happy New Year


Merry X'mas 2010 & Happy New Year 2011,


This year have been a wonderful journey, and definitely next year will be just even better.. :)

Tuesday 21 December 2010

GBP/USD week 4 cont...

A bullish divergent bar at support

Buy at 1.5476


Close Position
Close at 1.5476 (gut feeling), bep

need to be careful with bdb, better play it safe

EUR/USD week 4 cont....

15 min chart
Price went up, took a breath, then break the 3rd fractal up. Bill said, he normally takes the 3rd fractal. Let's see... :)

Buy at 1.3183


Close Position
Wow a big down bar

Close position at 3159, price close below red line, a total loss of 24 pips

Monday 20 December 2010

EUR/USD week 4

Saddle point, been resting quite a while..

Break down fractal, Sell at 1.3141


Close Position
Close position at 1.3170, total loss of 29 pips..

Price close above alligator..


2nd Trade
Saddle point, Break down fractal

Sell at 1.3150


Close Position
Close position at 1.3118, price close above green line, a total profit of 32 pips..

Missed Opportunity (the power of saddle point)
There was a saddle point, but didn't see it, T_T
Buy at 1.3130 and close at 3182 (one tick below BDB low), a total profit of 52 point, missed it, too early in the morning, still sleeping :)

AUD/USD week 4

Saddle point

Break up fractal, buy at 0.9908


Close Position
Bearish Divergent Bar

Close at 9898, a total loss of 10 pips..

GBP/USD week 4

Let's trade 15 min chart, been resting for a while then it breaks the up fractal.

Buy at 1.5526

hmm.. just noticed the AO, looks like it's still goin down, a move up possibly just a correction. Oh well, already bought it, let's see wat happen :)


Close Position
Hit my 5 bar stop loss

Close at 1.5546, a total profit of 20 pips..

If it breaks the up fractal, i'll jump back in..
I've put a buy stop at 1.5570..


2nd Trade
Break up fractal, buy at 1.5570


Close Position
Hit my stop loss at 1.5530, a total loss of 40 pips

Thursday 16 December 2010

EUR/USD week 3 cont..(2)


 Hit my Sell stop at 1.3205, break down fractal


Close Position
Just check this morning, my stop loss was hit at 1.3264, previous 2nd up fractal, a total loss of 59 pips

There is a bullish divergence bar and an AO divergence on the 15 min chart, and then a twin peak signal occurred in the hourly chart.

Looking at this, I would've closed my position based on the twin peak signal, one tick above the corresponding bar high at 3242 (37 pips losses), a smaller losses, well but i wasn't awake at that time. :) hmm should've thought about this when putting a position at night.. ok noted :)

Tuesday 14 December 2010

AUD/USD week 3 (Dec 10)

Same like Euro, market moves a up, took a breath then it breaks the up fractal..

Buy at 0.9967

Stop loss at 0.9941 for now or the red line


Close Position
No exit signal from hourly chart, close position based on gut feeling hehe, ao price divergence
15 min chart AO divergence, price close below red line, alligator start to sleep..

Close position at 0.9990, a total profit of 23 pips..

EUR/USD week 3 cont...

Market moves up, and took a breath. Then it break the up fractal....

Buy at 1. 3403

Stop Loss at 1.3371 for now (Previous 2nd fractal)


Close Position
Decide to close position using bearish divergent bar low instead of the red or the green line stop loss, coz AO and price divergence.... play it safe :)

Close at 1.3429, a total profit of 26 pips...

Monday 13 December 2010

EUR/USD week 3

Just found out, my buy stop got hit, break up fractal..
BUY at 1.3246


Close Position
Hit my 5 bar trailing stop
Close position at 1.3376, a total profit of 130 pips..

The power of saddle point, the longer it sleeps the better when it wakes up... :)

Friday 10 December 2010

EUR/USD week 2 (Dec 10) cont....

Buy at 3264

A bracketed market (saddle point), break up fractal.


Close Position 1


a bearish divergent bar, close position at 3261, 3 pips loss hehehehe... get ready to sell if it breaks the down fractal or buy again one tick above bdb high.. :)


Another Saddle Point

Sell at 1.3222

Daily chart: Alligator open up, price below alligator
4 hour chart: Alligator intertwine, price below alligator


Close Position 2
Close position, one tick above bdb high at 1.3226, a total loss of 4 pips..

Alligator still sleeping, a sideway market, watch this market carefully, the longer it sleeps the better. Won't miss this breakout.. :)

Thursday 9 December 2010

EUR/USD week 2 (Dec 10)


Hopefully my wave count correct...

Target zone would be around 3495-3669


Close Position
Hit my stop loss at 3242 (the last fractal), a total profit of 13 pips.
From floating profit 80+ pips :(

Forgot with the 5 bar stop loss at 3289 (+60 pips). Hmm.. need to remember that, since the trend still too early too tell, should've used tight stop...

Ok noted, Now let's just wait for next opportunity :)
Just remember the rule (saddle point)


2nd Trade of the day
Decided to enter the 2nd BDB, buy at 3230.

Had a couple of bad experience with wiseman 1, need to be careful with this one. That's why i entered on the 2nd bdb, need to make sure there's really a buying pressure out there and also it stops around 72% fibonacci, which is a typical end of wave 2.

Hopefully my wave count is correct. Well if it breaks 3179 then the wave count fails..

Why not give it a shot :) We'll see...


Close position

Hit my stop loss at 1.3193, a total loss of 37 pips :(
oh well.. let's wait for next opportunity..
Still need to figure how to use wiseman 1, a gambling phase indeed.. :)

Thursday 18 November 2010

AUD/USD Position Week 3

Back to hourly trading, guess i'm not ready yet to trade the daily (psychology and money management issue). 

1st and 2nd Trade (hourly chart)
Bought Aud at 0.9790 yesterday. For this one, i'll use trailing stop and just let the profit run..

Also bought at 0.9785 with a target profit: near Fibonacci 38.2 retracement at 0.9860.

We'll see how it goes... :)


Update Position


2nd Trade hit the target profit, a total profit of 70 pips :) not bad...


Still holding one position, let's see how far it can go


Update Position
Hit my trailing stop (one tick below the lowest previous 5 bar) close my 1st trade at 0.9870, a total profit of 85 pips :)

looks like fib 38.2 retracement become a resistance..

Should i buy if it breaks the up fractal? hmm... we'll see

Thursday 4 November 2010

GBP/USD Position week 1

My first trade using daily.. weww, nice move, woohooo!! I

As i said before (look GBP/USD view), buy if it breaks the up fractal around 1.6110..
I bought a lil bit higher though at 1.6131...Well the market moves as expected..
Let's ride the trend and i"ll use the red line as my protective stop loss...


17 nov 2010 (update) close position
Hit my stop loss at 1.5950, a total loss of 181 pips.

Hmm.. Daily trade, less work and monitor to do but with a bigger whiplash...

If it breaks the last up fractal, i'll jump back in...

Let's try trading with the 4 hourly chart....

Sunday 31 October 2010

GBP/USD View

GBP on Wave 3???

GBP/USD Trading Plan

Buy if it breaks the up fractal, around 1.6107

Stop Loss would be below the red line or one tick below the last down fractal at 1.5649..

Tuesday 12 October 2010

EUR/USD Week 2

1st Trade

Break Down Fractal sell @ 1.3913

Trailing Stop at 1.3884, guaranteed profit 29 pips..

Let's ride the trend, win small or hit the jackpot..

Should've add position from the 2nd box, but didn't see it, busy... :)


Close 1st Trade

Close position at 1.3852, hit my stop loss

Total profit of 61 pips...

Friday 1 October 2010

AUD/USD View

Until it breaks the trend line, just follow the trend. A strong up trend indeed, this is what they call a joy to behold (wave 3), trend is your friend. But It's too high now for me, well you can't say it's too high, coz there's always a possibility to go higher, all i can say is for me, it's too risky to have a buy position now, already had a couple AO and price divergence, the momentum decreasing.

4 Hour Chart
I'll sell if it breaks the first fractal below the red line or if the price break the trend line..

Let's just wait until that happen..

If I sell this, i'll be trading wave 4 and it can get bumpy. hopefully it's a normal zig zag abc correction. Otherwise, it can be a risky trade.

C'mon, give me a correction plisss.. hehehehe... :)

Wednesday 29 September 2010

EUR/USD Week 5

1st Trade
Double Divergence between AO and Price
Bearish Divergence Bar
Enter Sell @ 1.3603
Stop Loss @ 1.3641 (one tick above bdb high)

Still have to be careful though, 4 hour chart, still wave 3, not a wave 5. So im trading a possible abc correction of wave 4..

We'll see wat happen... :)


Close 1st Trade & 2nd Trade

my stop loss was hit, total loss of 38 pips

re-enter wiseman 2 sell @ 1.3594

hmm.. strong up trend indeed...


Close 2nd Trade
Another cut loss, total loss of 41 pips..

a strong wave 3 indeed..

oh well, let's just wait until it breaks the trend line.


i'm getting busy, so no more intraday trading for now, move to day trade, well bill william said his system works best at day trade, let's see wat happen...

Friday 17 September 2010

EUR/USD Week 3

1st Trade
Sell at 1.0365

Break down fractal (wiseman 3)


Close 1st trade and 2nd Trade
Close at 3074 (previous five bar high), total loss of 9 pips..

Buy at 1.3086 (Break fractal up), Stop loss at 1.3065 (previous five bar low)


Close 2nd Trade

Close 1.0375, total loss of 11 pips..

hmm... looks like a wave B...

Monday 13 September 2010

NZD/USD Week 3

1st Trade
4 hour chart: Wave 3, BDB, AO divergence
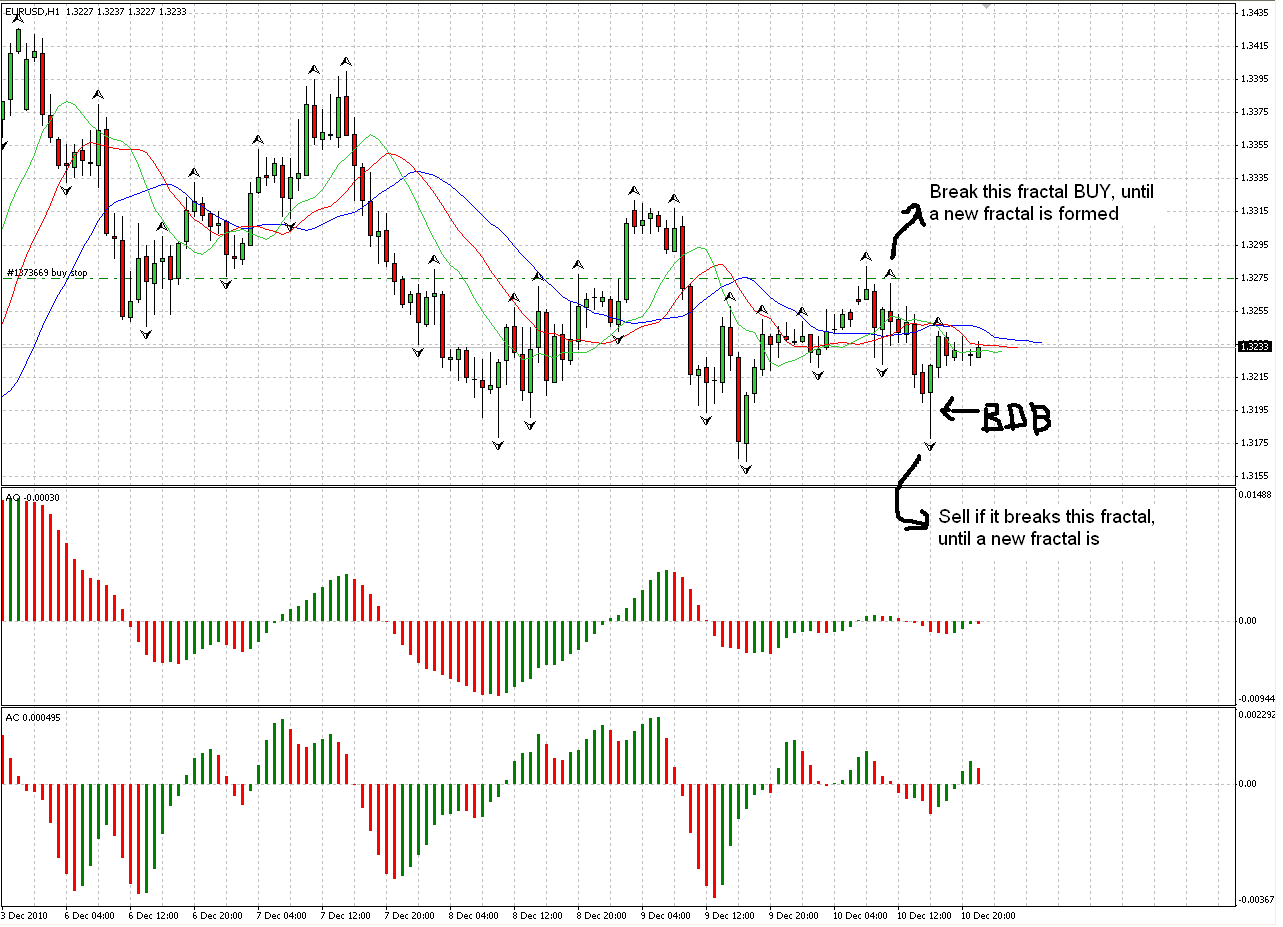
Hourly chart: Wave 5, BDB, AO divergence
15 min chart: Wave 5, BDB, AO divergence

so we're in wave 5:5:3, entering wave 4 abc correction..
possible target 0.7140-0.7183 (38.2 - 50 % fib retracement of wave 3)

Sell @ 0.7302 (BDB), Protective Stop Loss @ 0.7321 (one tick above BDB high)


2nd Trade


Enter wiseman 2

Sell @ 0.7291, Protective Stop Loss @ 0.7318

Let's try using reverse pyramiding (look at trading chaos 2nd Edition)


Close 1st and 2nd Trade
hit my stop loss
1st trade total loss is 16 pips

2nd trade total loss is 27 pips x 3 lots = 81 pips


3rd Trade
Another Bearish Divergent Bar

Sell at 0.7315, Stop Loss at 0.7344


4th Trade

Wiseman 2

Sell at 0.7314, Stop Loss at 0.7344


Close my 3rd and 4th Trade

Hit my stop loss

3rd trade total loss is 29 pips
4th trade total loss is 30 pips x 3 lots = 60 pips


5th Trade

Break down fractal
Sell at 0.7286

Let's use previous five bar high to protect the loss..

Ride the trend with trailing stop.


Close 5th Trade

stop loss was hit
total loss of 10 pips


Chart Update (no position)

Always put your protective stop loss :)

careful next time when trade wave 3 to wave 4

now which elliot wave, no idea hehe, wait for the market to chill... :)