Saturday 22 January 2011

Weekly Trading Review

EUR/GBP Hourly

This trade start with a bearish divergent bar with AO and Price divergence. price starts to go down and then it went up and create a fractal down (1) and then it started to go down again break the down fractal (1).

I normally take this type of setup, is like an abc pattern. wave a down and then wave b up and then it can't go higher continue to go down and break the down fractal (1) which is the end of wave a.

So i enter sell at 0.8388 and then another fractal breakout (2), add on Sell at 8347. Notice before fractal 2 there's a bullish divergent bar. I normally exit at that point, but this time whenever there's no divergence at AO and price, i use the green and red line as my exit point.

Then after fractal 2, there's an AO divergence, and it's time to tighten up my stop, a bullish divergent bar or a 5 bar trailing stop. This time is a 5 bar trailing stop (3), close all my position at 0.8362. a total profit of 11 pips.


USD/CHF Hourly

This is my 2nd trade, a saddle point on USD/CHF. Enter sell at 0.9636 (Break fractal 1) then close my position at 0.9624 (5 bar trailing stop), a total profit of 12 pips. a volatile market indeed..

Saturday 15 January 2011

Weekly Trading Review

EUR/GBP Hourly Chart
A nice saddle point, AO and AC around or near zero, the alligator sleeps for quite a while with a bracketed market. Well this is a good setup to enter a trade according to Bill Williams.

Started by entering the 1st fractal breakout, buy at 0.8325 and then got stop out at 0.8307 (fractal 2 breakout), I guess it's a bit too early, since the alligator mouth was shut tight. a total loss of 18 pips

Stop and reverse on fractal 2 breakout, Sell at 0.8307 then I got stop out again at 0.8336 (fractal 3 breakout), a total loss of 29 pips

Stop and reverse again on fractal 3 breakout, Buy at 0.8336, the alligator starts to open, then the price came back and close below the red line, Close position at 0.8322, a total loss of 15 pips

Another fractal breakout (4th fractal), enter buy at 0.8341, the alligator opening up and the trend took off, add position by entering fractal 5 breakout, buy at 0.8360. Close both position when price go one tick below the bearish divergent bar (6) at 0.8423. A profit of 82 pips and 63 pips.

Didn't take the 6th fractal, don't want to be too aggressive, looking at the AO, no divergence yet, no wave 5 yet, so probably it's running in wave 4, possibly wave c of 4 and also price still below 61.8 fibo on 4 hour chart, so it's possible, EUR/GBP still in bearish mode, waiting for a wave 5 down, otherwise let's just wait for another saddle point...

So this week trade make a total profit of 83 pips..

Wednesday 5 January 2011

The Amazing of Trading Chaos by Bill Williams on AUD/USD


Let's examine this chart.

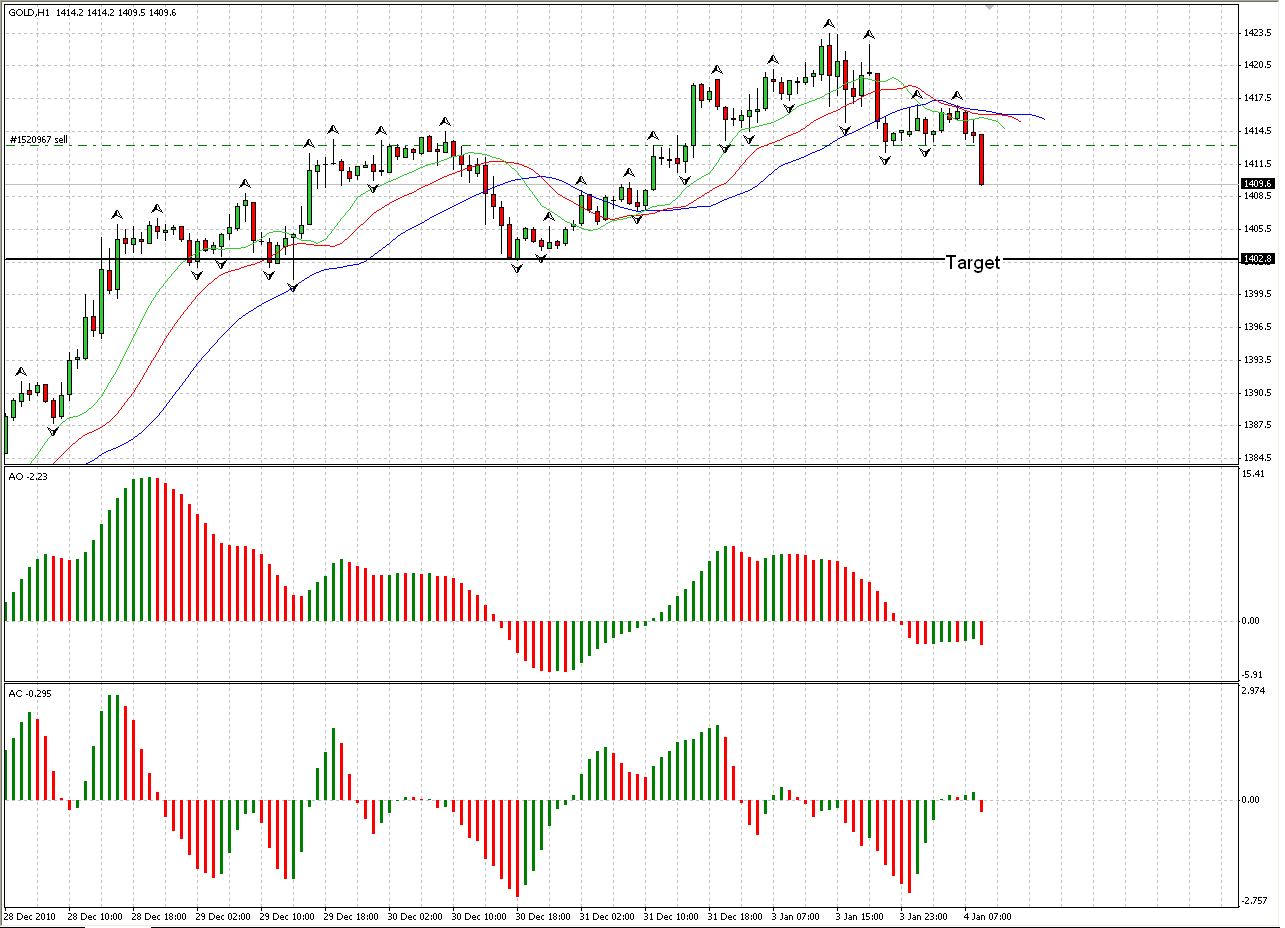
Bill Williams count the Elliot wave based on AO not on Price, so we know that the peak at point Z is wave 3, and then the AO went beyond zero which is the minimum requirement of wave 4 then it goes up again until it peaks at point X. Notice here, the AO at point Z is higher than point X but the price goes higher, this is called a Divergence between price and AO. Whenever there's a divergence, it's a wave 5.

So we know there's wave 3, 4 and 5 up, then the question, is this the end of a trend?

Bill Williams use what he calls, 5 magic bullet. When all 5 magic bullets presence, most of the time it will kill a trend. Now let's look what are this 5 magic bullet (in no particular order, all 5 need to be there) and look if it appears on this chart.

1. Divergence between AO and price
2. Fractal up/down
3. Squat bar/Bearish divergence bar (BDB)
4. Price in the target zone (use Fibonacci expansion, draw from the bottom of wave 1 to the top of wave 3, most of the time a trend will end between 62-100 % fib expansion)
5. Momentum change (AO from green to red or from red to green)

If you look at the chart, all 5 magic bullets presence


So from there we know that it's the end of a trend.Then we can be confidence to enter a trade
1. Wiseman 1, Sell one tick below bdb low at 1.0230 (for aggressive trader)
2. Then add Wiseman 2 (Three consecutive AO of the same color) Sell at 1.0180 (aggressive trader)
3. Add Wiseman 3, break down fractal, Sell at 1.0183
4. Add Wiseman 3 again, break down fractal, Sell at 1.0172
5. Add Wiseman 3 again, break down fractal, Sell at 1.0154


Then there's a bullish divergent bar (6) with AO divergence, Close all position at 1.0057
1. profit 173 pips (reverse pyramid 173 pips)
2. profit 123 pips (reverse pyramid 615 pips)                
3. profit 126 pips (reverse pyramid 504 pips)
4. profit 115 pips (reverse pyramid 345 pips)
5. loss 3 pips (reverse pyramid 6 pips

a total profit of 534 or a total profit of 1631 if using reverse pyramid method.

The other way to trade this is using his earlier method, wait for a saddle point then start to enter when it breaks fractal no 4, a trend following method but if you're an aggressive trader you can use the 2nd edition method, wiseman 1, 2 (counter-trend) and wiseman 3 (trend following).

If you use the green or red line stop, u'll still be in the market. The choice is yours.. :)

I tend to be careful and tighten up my stop loss if i look a divergence in AO and price..

For a better picture of this method, I strongly recommend you all to read all of his book, trading chaos, new trading dimension and trading chaos 2nd edition. Good luck and Happy Trading :D

Tuesday 4 January 2011

EUR/USD week 1 (2)

1st and 2nd Trade
Saddle point

1st Trade
Break down fractal (x), Sell at 1.3327
Got stop out at 1.3380, a total loss of 53 pips

2nd Trade
Stop and reverse, break up fractal (z),
Buy at 1.3380


Close Position
Close my 2nd trade, hit my trailing stop loss, one tick below the bearish divergent bar low at 1.3386, a total profit of 6 pips..


3rd Trade
Decided to stop and reverse,
Sell at 1.3389


4th and 5th Trade 
Close 3rd trade, Hit my BDB high stop loss at 1.3419, a total loss of 30 pips

Then 4th trade, I stop and reserve at 1.3419, Got stopped out 1.3377 (5 bar trailing stop), a total loss of 42 pips..

5th Trade, break down fractal x, Sell at 1.3322


Should've added when it break fractal Z, but didn't see it.. Well if it goes around fractal Z, I'll add sell...


Close Position
Close my 5th trade at 1.3216, no sell signal but I need to go somewhere, can't monitor if i use the green or red line, coz it's a stop close only.. 

There's triple divergence anyway on 15 min chart so i play it safe.. :)

a total profit of 106 pips

Missed fractal X, so I didn't take fractal Z, risk management issue..

GOLD XAU Week 1

Price AO divergence,
Price went down then a pullback (wave b) then down again break down fractal, hopefully a wave c...

Sell at 1413.2


Close Position
Close one tick above bullish divergent bar high at 1408.8, a total profit of 44 pips

AUD/USD Trading Plan

4 Hour Chart
a possible end of a trend...

Let's wait for the price to pullback (wave b up) then enter hopefully wave c down... :)

Monday 3 January 2011

AUD/USD week 1

15 min Chart
Saddle point, Break up fractal

Buy at 1.0209


Close Position
Close at 1.0178, a total loss of 31 pips


2nd Trade
There's Bullish Divergent Bar between 50 - 61.8 Fibo, if my wave count correct, a possible end of wave 4..

Let's give it a try, buy at 1.0191


Close Position and 3rd Trade
Hit my stop loss at 1.0173, total loss of 18 pips..

Stop and reverse, Sell at 1.0174


Close Position 
Hit my stop loss at 1.0195, and then it went up, just nice! a total loss of 21 pips... :(


Sunday 2 January 2011

EUR/USD Wave Count Week 1

Daily Chart
This chart is quite confusing for me, there's a chance that we're in the beginning of wave 5 up. But according to Bill Williams' unbreakable rule is that wave 4 never goes below the top of wave 1 which is happened in this chart. So i'm totally lost here, better not trade this daily chart for now, it's inside the alligator mouth anyway.. let's hope there's a saddle point.......

Let's move down to 4 hour chart and look what's happening inside the box to find a possible trade...


4 Hour Chart
More confusing, totally no idea what wave we're in, a big sideway market, no wonder, it's inside the alligator mouth (look at the box on daily chart) but at least we have price outside the alligator, and the alligator is awake..

Let's move down to Hourly chart and find out what's happening inside the box....


Hourly Chart
Looks like the up move on the 4 hour chart still running in a possible wave 3, not sure, because the AO peaks at X not Y, but looking at its slope, it's a typical wave 3. Let see if the AO can peak on Y. Until then i'll just wait n see..


So for EURO/USD, it's better to wait and see until we have a clear view of the wave count or  a saddle point... :)