Thursday 29 December 2011

A simple false break with BDB (GBP/USD)

GBP/USD Hourly

If you patience enough to wait for the good setup to trade, then money will come to you...

Saturday 24 December 2011

Daily Trade Review (23 Dec 2011)

GBP/USD Saddle Point, Fractal Breakout

GBP/USD Hourly

Wait for the european, best at london open for fractal breakout..

Enter buy at 1.5708 (break fractal 1), got stopped out at 1.5679, -29 pips loss

Stop and reverse, enter sell at 1.5679 (break fractal 2).. Closed half of my position at 1.5629 for 50 pips profit and let my remaining position to run.. Might get small profit or hit a jackpot, we'll see...


Wednesday 21 December 2011

Daily Trade Review (21 Dec 2011)

EUR/USD BDB False Break
EUR/USD Hourly

Enter Buy at 1.3111, Stop Loss at 1.3100 (11 pips risk)
Let's see how this turn out. The bdb tail a bit short though and the AO is decreasing, but we'll see, only 11 pips stop loss, I'll take my chances (good risk and reward ratio). one hour and half before london' market open..

UPDATE
EUR/USD Hourly

I'm out from my position at 1.3112, 1 pips profit.. Price rejected near resistance, let's wait for another opportunity, keep watchin this chart..

UPDATE
EUR/USD Hourly

Let's try to sell, at 1.3112, Stop loss 1.3130 (18 pips risk)

UPDATE (Fractal Breakout)
EUR/USD Hourly

Got Stopped out at 1.3130 for a -18 pips loss, let's stop and reverse, buy break fractal at 1.3130

UPDATE
EUR/USD Hourly

My limit profit got hit at 1.3170, for 40 pips profit.. This is key level, near resistance and fibonacci 79 retracement.. Now price stall at support, watching if there's a bullish candle formation..

UPDATE
EUR/USD 15 min Chart

Spotted a bullish divergent bar at 15 min chart, buy at 1.3091 for a 20 pips stop loss at 1.3071.. Let's see..

UPDATE
EUR/USD 15 min Chart


Got stop out at 1.3071 for a -20 pips loss...

UPDATE (BDB at 61.8 Fibonacci)
EUR/USD 15 min Chart

Re-enter, another BDB, buy at 1.3074, Stop loss at 1.3056 (18 pips risk)..

UPDATE
EUR/USD Hourly

Got stop out again, -18 pips loss..  Well that's trading, sometimes you win, sometimes you lose, but keep your losses at minimal level, total losses only -15 pips, not bad.. This is part of the game, no worries.. Now let's wait for another opportunity...

UPDATE
EUR/USD Hourly & Daily Chart


Daily Trade Review (20 Dec 2011)

EUR/USD Saddle Point, Fractal Breakout
EUR/USD Hourly

Enter buy at 1.3017, break fractal at london open
Closed half of my position at 1.3077 for 60 pips profit (near resistance)
and Closed my remaining position at 1.3105, for 88 pips profit (break bdb low)

Hmm.. let see if using the red or green line, how far will it go. But since it's a downtrend, I choose tighter stop..

Saturday 17 December 2011

Daily Trade Review (16 dec 2011)

USD/CAD Bullish Divergent Bar at Fibo 61.8 level
USD/CAD Hourly

1st attempt, enter buy at the first bdb at 1.0318, Stop Loss at 1.0302 (16 pips risk) and I got stopped out, -16 pips loss.. But i believe this level is gonna hold.

2nd attempt, zoom out into 15 min chart, another bullish divergent, enter again buy at 1.0310, then got stopped out again at 1.0298 for -12 pips loss. Always keep your cool and watch the chart carefully, don't get your emotion run ur mind..

USD/CAD 15 min

3rd attempt, another bullish divergent bar, enter buy at 1.0313, stop loss at 1.0295 (18 pips risk)...
Closed half of my position at 1.0360 for 37 pips profit and closed the other half at 1.0403 for 90 pips profit..


AUD/USD Bearish Divergent Bar at Fibo 50 level
AUD/USD Hourly

Sell at 1.0002, Stop loss at 1.0022 (20 pips risk),  and I got stop out for -20 pips loss.
Didn't re-enter, can't see any bdb, but there's a railway track, to busy looking at usd/cad so i missed it..

Thursday 15 December 2011

Daily Trade Review (15 dec 2011)

EUR/USD BDB False Break
EUR/USD Hourly

Buy at 1.3036, Stop Loss at 1.3056 (20 pips risk)
Closed 2/3 of my position at 1.3009 for 27 pips profit, and got stopped out at 1.3056 for my remaining position, -20 pips loss

Wednesday 14 December 2011

Daily Trade Review (14 Dec 2011)

EUR/USD BDB False Break
EUR/USD Hourly

Buy at 1.3209, Stop loss at 1.3239 (30 pips stop loss)
Closed half of my position at 1.3163 for 46 pips profit
My earlier plan is to let my remaining position to run and trail the stop, but got a bit scared looking at the big down candle so I just closed it at 1.3089 for 120 pips profit, hoping for a pullback to re-enter but price keep going down since there's no support nearby...

Could've hit the home run but didn't have the guts, oh well it's a good trade after all, still learning to want what the market wants.. : )


AUD/USD BDB 61.8 Fibonacci 
AUD/USD Hourly

Whenever price at key level, try to find a sell signal, zoom out to 15 min chart

AUD/USD 15 min

Buy at 1.0143, Stop loss at 1.0166 (23 pips stop loss)
Closed half of my position at 1.0080 for a 63 pips profit (near support and 61.8 fibo level)
Closed my remaining position at 1.0043 for a 100 pips profit

USD/CAD BDB 50 Fibonacci
USD/CAD 4 Hour


USD/CAD Hourly

Buy at 1.0267, Stop Loss at 1.0293 (26 pips risk)
Closed half of my position near support at 1.0237 for 30 pips profit
My remaining position got stopped out at break even, 0 pips (trail my stop to my buy point)

Tuesday 13 December 2011

USD/CAD T12/12/11 Trade Review

USD/CAD Hourly

USD/CAD 15 min

Buy at 1.0185, Add position at 1,0210.
Closed half at 1.0228 for 43 pips and 18 pips profit
Closed the remaining near resistance at 1.0258 for 73 pips and 48 pips profit

Then I traded the reversal
USD/CAD 15 min

Bearish divergent bar, Buy at 1.0258, Targeted at 61.8 fibo but it rejected at 50 fibo, so I just closed half of my position at the rebound at 1.0244 for 14 pips profit and closed the remaining at buying point for a break even, 0 pips..

Now there's a divergence, I'm waiting for sell signal...

Saturday 10 December 2011

USD/CAD Reversal Trade

USD/CAD Hourly

Spotted this AO divergence, price failed to maintain its new low, creating a bullish divergence bar, enter buy at the next candle open at 1.0079, Target would be around 38.2 - 50 fibonacci retracement. First attempt of reversal, Price will always come back and re-test the low, so we want to secure our profit first..

Closed my position at 1.0119 for a 40 pips profit


USD/CAD Hourly

Then price retrace and form a bdb at around 79 fibonacci retracement, enter again, buy at 1.0099, but i got stopped out this time at 1.0080 (one tick below the bdb low) for a 19 pips loss..

Once again price create a new low but failed to maintain below and form a bdb again, enter buy at 1.0080, This is the second attempt, so i target my profit at arround 61.8 fibonacci, closed 2/3 of my position at 1.00140 for a 60 pips profit and closed the remaining near resistance at 1.0195 for a 115 pips profit

This is why AO divergence has been one of my favourite, trading reversal, good risk and reward ratio.. : )


Saturday 26 November 2011

GBP/USD Weekly Trade (21 - 25)

GBP/USD Hourly

Buy at 1.5538, I was expecting an abc reversal type pattern but failed, got stopped out at 1.5515, -23 pips loss.. Well it's a part of the game, sometimes you win, sometimes you lose, it's all about probability. The important thing is your risk has to be greater than your reward..

2nd trade, following the trend, typical false break...
GBP/USD Hourly

Zoom out to 15 min chart, we'll get an earlier entry and with a tight stop..

GBP/USD 15 min

Watch closely how the price break its support then retrace back to it's support become resistance with a bearish candle. Sell at 1.5480, Stop Loss will be just above the resistance at 1.5495, a 15 pips risk level..
Closed half at 1.5450, a 30 pips profit and closed the remaining at 1.5430, 50 pips profit. Noticed the divergence, I always play it safe whenever there's a divergence, when I feel in doubt I just get out...

Look at the hourly chart, we got an early reversal signal, bdb with triple divergence, wait for a false break, a bullish candle or a tight pattern...


EUR/USD Weekly Trade (Week 21 - 25)

Lets start with EUR/USD.. If we read the news, we all know that the situation in euro zone is bad right now,. I don't think they'll come up with any solution to get out from the debt problem anytime soon. That's why i will always look for short opportunity in eur/usd, not going to buy unless i see a really really clear reversal sign..

I've been learning about price action these days, using support and resistance, candlestick pattern combine with chaos method and it really amazed me... I rarely use the alligator now, but I still use it sometimes to trail my stop..

Now let's look at the chart
EUR/USD Hourly

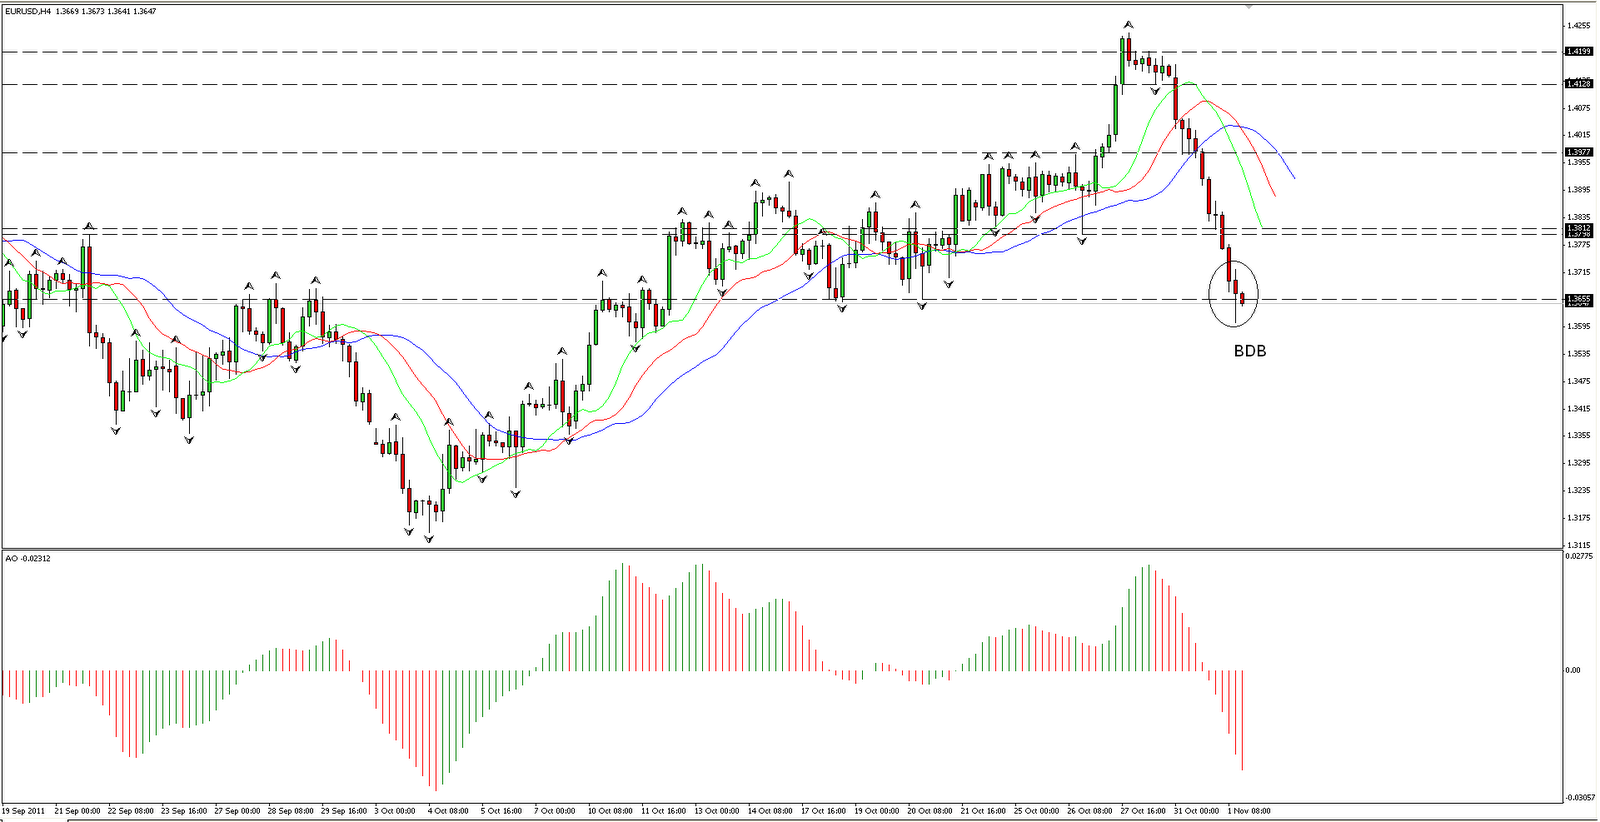
Price break strong support after consolidate for a while, then there's BDB 1 near resistance, our first signal, a false break, if we zoom out to 15 min chart, we can see a clearer picture..

EUR/USD 15 min

Sell at 1.3402, Stop loss would be one tick above the bdb high at 1.3416 (-14 pips risk level)
Closed half of my position at 1.3375 for 27 pips profit and closed the rest at 1.3342, 60 pips profit..

Then there's BDB 2 (hourly chart), I was hoping it to come more close to the resistance, so I missed it then there's the breakout - continuation type of pattern. Let's zoom out to 15 min chart...

15 min chart

Enter sell at 1.3313 (breakout fractal), Stop loss at 1.3336
No more support, no sell signal so I just let it run for this one, Closed 2/3 of my position at 1.3213 for 100 pips profit and let the remaining, just in case it goes down near to its daily low at 1.3144.
But the price rebound and hit my trailing stop at 1.3260 for 47 pips profit..

Then there was BDB 3, I was expecting this, every time I see this candlestick patttern, I will always look if there's a key level (support/resistance) near it. I can't see it in the hourly chart, but if you zoom out to 15 min chart, we can get a clearer view..

15 min chart

Enter sell at 1.3276, since it's friday and near the close of the day, I closed all my position near 61.8 fibo retracement at 1.3246 for 30 pips profit...


Tuesday 22 November 2011

GBP/USD Candlestick Pattern trade

GBP/USD Hourly

Price rebound then stall at resistance with bearish reversal candlestick type, I think it's called morning star or i don't know, cant remember haha... Well the name is not important, if you look closely and understand how the candle stick is formed..

Sell at 1.5670, Stop loss at 1.5695 (25 pips risk)
planned to close half of my position near support, but it was just a couple pips away, before price rebound again, then I just closed half at 1.5560 for a 10 pips profit and let the remaining just in case, i was ready with my 25 pips risk..

Then there's a bearish divergent bar candle, confirming the selling pressure, Sold again at 1.5655. Moved my stop to 1.5683 (one tick above the bdb high).. So I had 1 and a half position..

Closed 2/3 of my position at 1.5615 (resistance), 40 pips profit and let the remaining profit to run..

But there's a reversal sign, false break with a railway tracks candlestick formation and a AO divergence, so I just closed it for 20 pips profit...

Wanted to trade the reversal, but the stop loss is too far for me...

Oh well until next opportunity....

Monday 21 November 2011

GBP/USD False Break Trade

GBP/USD Hourly

At Asia session, price was consolidating, a tight pattern then near europe open, price made an attempt to break to the upside, but failed.. I've seen this false break many times with bearish candle formation (hammer/bearish divergent bar). I consider this as a high probability setup and one of my favourite..

Enter sell at 1.5737, Stop loss at 1.5780 (just one tick above the bdb high)

Closed half of my position near support at 1.5697, 40 pips profit. After that I moved my stop loss at break-even for my remaining position..

The plan is to let it run and trail my stop since it breaks strong support, but got little bit scared so I just aimed for 1:2 risk reward, put a target profit at 1.5650, which was hit, 87 pips profit..

Now i'm waiting for price to retrace to resistanc..


Tuesday 1 November 2011

One of my favourite, Tight Pattern on EUR/USD

EUR/USD Hourly

This is one of my favorite pattern, a simple one yet so powerful..

Missed the first one, it happen too early, i wasn't expecting it, happen in tokyo session..

I kept watching this pair, since there still doubt about how euro will handle their debt issue,

Price started to consolidate, a descending triangle (lower high) right at strong support,
enter break fractal, sell at 1.3965...

Then price consolidate again, another tight pattern, sell again  at 1.3809 (break down fractal at support)

Closed all position at 1.3700, total profit 265 + 109 = +374 pips, my biggest profit so far in a single trade..

At the moment price stall at 4 hour support area around 1.3650, a BDB, price rejection around support, but looks like it's gonna break for further down move

EUR/USD 4 Hour


Monday 24 October 2011

This is why I love AO Divergence

EUR/USD Hourly

Whenever I see a divergence, I'll be looking for a false break, a tight pattern or fail to break new high (abc pattern).

For this one there was a false break with bearish divergence bar, sell at 1.3879 (one tick below bdb low). Closed half of my position near support at 1.3830, + 49 pips and Closed half at 1.3770 (close above the green line), +109 pips... Total profit, +79 pips.


Monday 17 October 2011

My Favorite abc Pattern on EUR/USD

EUR/USD Hourly

There is a potential abc pattern in the making with double divergence, wait for a false break, near high or a saddle point, tight pattern like in my previous setup...

Previous Setup:

Divergence in price and AO, go down to point a with tight pattern and then rebound to point b, fail to break previous high, come back down again and break the down fractal, enter sell at 1.3766, close half of my position at 1.3700 (near the support) just in case it breaks the support level, but it fails then close half at the bdb (point c) high at 1.3711.. total profit + 60 pips..

and now I'm waiting for another abc pattern...

Monday 10 October 2011

EUR/USD Potential abc pattern

EUR/USD Hourly

We got an early signal of reversal, divergence between price and AO. Now I'm waiting for a saddle point, tight consolidation pattern or break support area to confirm the abc pattern...

Similar pattern on AUD/USD hourly chart...

UPDATE
EUR/USD Hourly

Failed to make abc pattern, price move higher break up fractal and AO also increasing.. oh well until next setup..

Tuesday 4 October 2011

EUR/USD Breakout - Continuation Pattern

EUR/USD Hourly

Sideways throughout the day, then it breaks its support level, break the down fractal, a continuation pattern, Euro news still bad, 4 hour and daily chart all pointing down trend, and I missed it T_T

If you zoom out to 15 min chart, we'll have a nice entry there...

EUR/USD 15 min

Break the support level then it bounce back before it went back down again and break the down fractal (fractal below the support level). Sell at 1.3305. I'm lookin at 1.3200 now on my screen, a 100 pips move...

Oh well until next opportunity : )

Monday 3 October 2011

GBP/USD

GBP/USD Hourly
Waiting for continuation pattern...

Sunday 2 October 2011

GBP/USD Trade (26 - 30 sep)

GBP/USD Hourly

Same double top pattern with divergence like EUR/USD here but this one fail, enter fractal 2 breakout, missed fractal 1 breakout, sell at 1.5580, then price rebound at support, close my position at 1.5600 for -20 pips loss.

EUR/USD Trade (26 - 30 Sep)

EUR/USD Hourly

Double top with divergence between AO and Price, then it formed an abc pattern. Missed fractal 1 breakout, enter on fractal 2 breakout, sell at 1.3520, then i just got out for 100 pips at 1.3420..

Don't have the guts back then to add on, fractal no 3 and 4 breakout, still learning to wants what the market wants :)

Saturday 24 September 2011

EUR/USD Trade (19 - 23 Sep)

Eur/Usd Hourly

Eur/Usd break support and I was just following the momentum, enter sell at 1.3552, break down fractal below support line.. Out at 1.3452 for a 100 pips profit. My original plan is to trail the stop or using the red/green line, but 100 pips tempted me, so i just took it :)

Noticed the saddle point there, a good opportunity to enter the market, hopefully no gap up or down on Monday..

Sunday 18 September 2011

EUR/USD Trade (Week 12 - 16 Sep)

EUR/USD Hourly

Trading Plan

Enter on bullish divergent bar,
Buy at 1.3616..
Stop loss would be just below the bdb low at 1.3588 (risk level -28 pips)
Using 1:3 risk reward ratio, out at 1.3706 (just near resistance) + 90 pips

Why did I take this trade?

I noticed there's a bullish divergent bar (bar no 1), then another bdb (bar no 2) and Euro keep making lower high. I kept watching this market, until the 3rd bdb was formed and then the next bar break its high, but i didn't buy it straight away. luckily it retraced, giving me a chance to buy at 1.3616. I'm comfortable with the risk level, so I took it..

Saturday 10 September 2011

EUR/USD Trade (Week 5 - 9 Sep)

EUR/USD Hourly

Saddle point
1. bracketed market with an up and down fractal (tight consolidation pattern)
2. alligator is sleeping
3. AO and AC near zero

Then it break the down fractal, Instead of selling it at 1.4050 (one tick below the down fractal), I wait for a pullback to have my 30 pips stop loss (risk control), Sell at 1.4060 with a stop at 1.4090..

Closed it at 1.3970, (using risk and reward 1:3), + 90 pips..

Using the red line, I'd still be in the market with a floating profit of 400 pips.. , but don't have the guts back then.. Still learning to want what the market wants : )

Also missed a couple of good trade since i'm not comfortable with the risk level, i didn't take it.. (risk control)

"Don't worry about the trade we missed, be prepared of what's coming next"

Until next opportunity...